- Why Generic Dashboards Fail Contact Centers
- Core Components of a Custom Built CRM Dashboard
- Real-Time Analytics: What to Measure and Why
- KPI Tracking That Drives Operational Decisions
- Step-by-Step: How DialerKing Builds Your Custom Dashboard
- Real-World Use Case: High-Volume Outbound Centre
- Integration with VICIdial, Asterisk & IVR Systems
- Frequently Asked Questions
- Conclusion
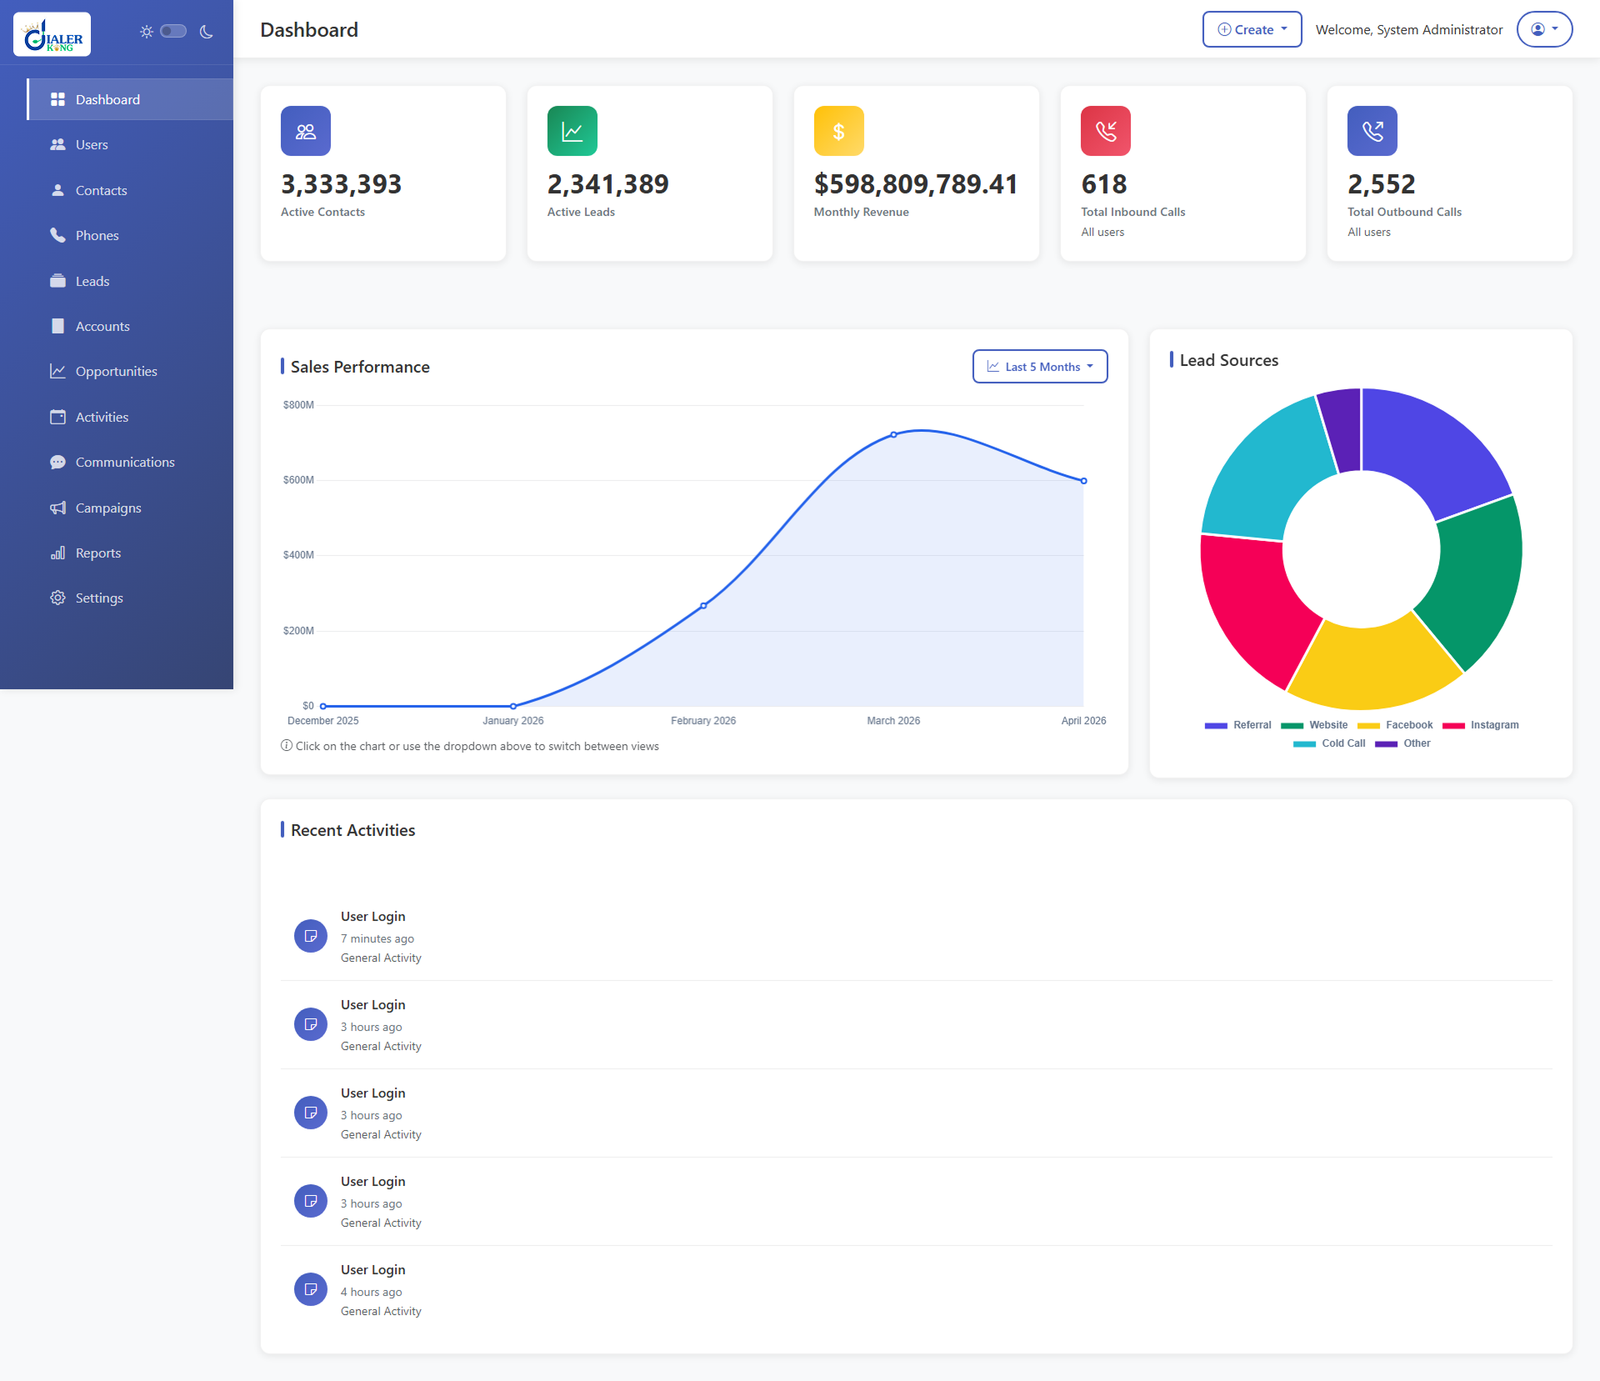
A custom built CRM dashboard is the operational nerve centre of any serious contact centre, providing supervisors, managers, and agents with a single, live view of every metric that determines whether a shift is succeeding or failing. Unlike off-the-shelf reporting tools bolted onto existing telephony stacks, a purpose-built CRM dashboard is designed around your specific workflows, your queues, your KPIs, and the data your teams actually act on.
This guide explains what that build process looks like, which metrics belong on every dashboard, and how DialerKing delivers these systems for contact centre operations running VICIdial, Asterisk, and custom IVR deployments.
Why Generic Dashboards Fail Contact Centers
Most contact centre operators arrive at the same frustration: they deploy a CRM or workforce management platform, activate the built-in reporting module, and within weeks discover that the data they need is either buried three menus deep, refreshes every 15 minutes, or simply does not exist as a configurable widget. Generic dashboards are built around the broadest possible use case. A custom built CRM dashboard is built around yours.
The operational gap is significant. A generic tool might show total calls handled today. What a contact centre supervisor actually needs is calls handled by queue, by campaign, by agent skill group, against an hourly target, compared to the same hour last Tuesday, with a live alert when any queue breaches a two-minute wait threshold. That level of specificity requires custom development.
The Hidden Cost of Delayed Data
Delayed reporting is not a minor inconvenience, it is a decision-making liability. When a supervisor learns at 5 PM that abandonment rates spiked at 2 PM, the only option is a retrospective conversation. With real-time analytics embedded into a custom dashboard, that same spike triggers a visible alert the moment it crosses the threshold, enabling an immediate reallocation of agents from a quieter inbound queue.
Core Components of a Custom Built CRM Dashboard
A well-scoped custom-built CRM dashboard is not a single screen, it is a layered system of views, each calibrated to the role of the person looking at it. These are the foundational components DialerKing engineers design into every deployment.
Live Agent Status Panel
Every agent currently logged in is visible with their current state: available, on call, in after-call work, on break, or paused. Colour coding makes status distribution scannable at a glance. This panel is the supervisor’s primary tool for intraday workforce management.
Queue Performance Monitor
Each active queue displays calls waiting, longest wait time, service level percentage, and calls answered within the defined SLA window. Threshold-based colour changes: green, amber, red, replace the need for manual calculation. This is where real-time queue analytics deliver immediate operational value.
Campaign & Dialler Metrics
For outbound operations running predictive or progressive diallers through VICIdial, the dashboard surfaces dial rate, connect rate, right-party contact percentage, and drops per hour, all live. Campaign managers use this panel to adjust dialler aggressiveness without leaving the interface.
KPI Scorecards by Agent and Team
Individual and team KPI scorecards draw from call records and CRM interaction logs to show average handle time (AHT), first-call resolution (FCR) rate, calls per hour, and quality scores where an evaluation workflow is in place. These scorecards update continuously throughout the shift.
Historical Trend Overlays
Live data without context is incomplete. Historical overlays allow supervisors to place today’s numbers alongside the previous week, previous month, or a comparable campaign period. This single feature transforms a status monitor into a forecasting aid.
Real-Time Analytics: What to Measure and Why
Real-time analytics is not the same as a faster report. It is a fundamentally different data architecture, one that streams events from the telephony layer into the dashboard as they occur, rather than batching them for periodic aggregation. DialerKing implements this through direct integration with Asterisk’s AMI (Asterisk Manager Interface) and VICIdial’s live reporting database tables.
The metrics below form the baseline for any contact centre dashboard. Additional KPIs are scoped during the discovery phase based on the client’s specific operational model.
Inbound Metrics
- Service Level – percentage of calls answered within target time
- Abandon Rate – calls that disconnect before an agent answers
- Calls in Queue – current depth and intraday peak
- Average Handle Time (AHT) – talk time plus after-call work
- Dial attempts per hour
- Live connect rate
- Wrap-up time per agent
- Dropped call percentage
- Campaign penetration rate
Outbound Metrics
Agent Productivity Metrics
- Utilisation rate, percentage of available time spent on calls
- Adherence to schedule
- List Calls handled versus targettem
- Average after-call work duration
These metrics do not operate in isolation. A skilled operations manager reads the relationships between them: rising AHT alongside stable volume often signals agent confidence issues or a new query type, not a staffing shortage.
KPI Tracking That Drives Operational Decisions
KPI tracking is only valuable when the KPIs being tracked are directly connected to business outcomes. One of the most common mistakes in contact centre reporting is measuring activity rather than performance. Calls handled is an activity metric. First-call resolution is a performance metric. Both matter, but they answer different questions.
DialerKing’s dashboard development process begins with a structured KPI mapping session that connects each proposed metric to a specific operational decision or business goal. This prevents dashboard bloat, a screen so crowded with numbers that supervisors stop consulting it.
Threshold Alerting
Every KPI on a custom built CRM dashboard can carry a configurable threshold that triggers a visual alert when breached. Abandon rate exceeds 8%? The queue panel turns red and an alert banner appears. A specific agent’s AHT hits double the team average? Their row in the scorecards highlights immediately. These alerts shift supervisor behaviour from reactive monitoring to proactive intervention.
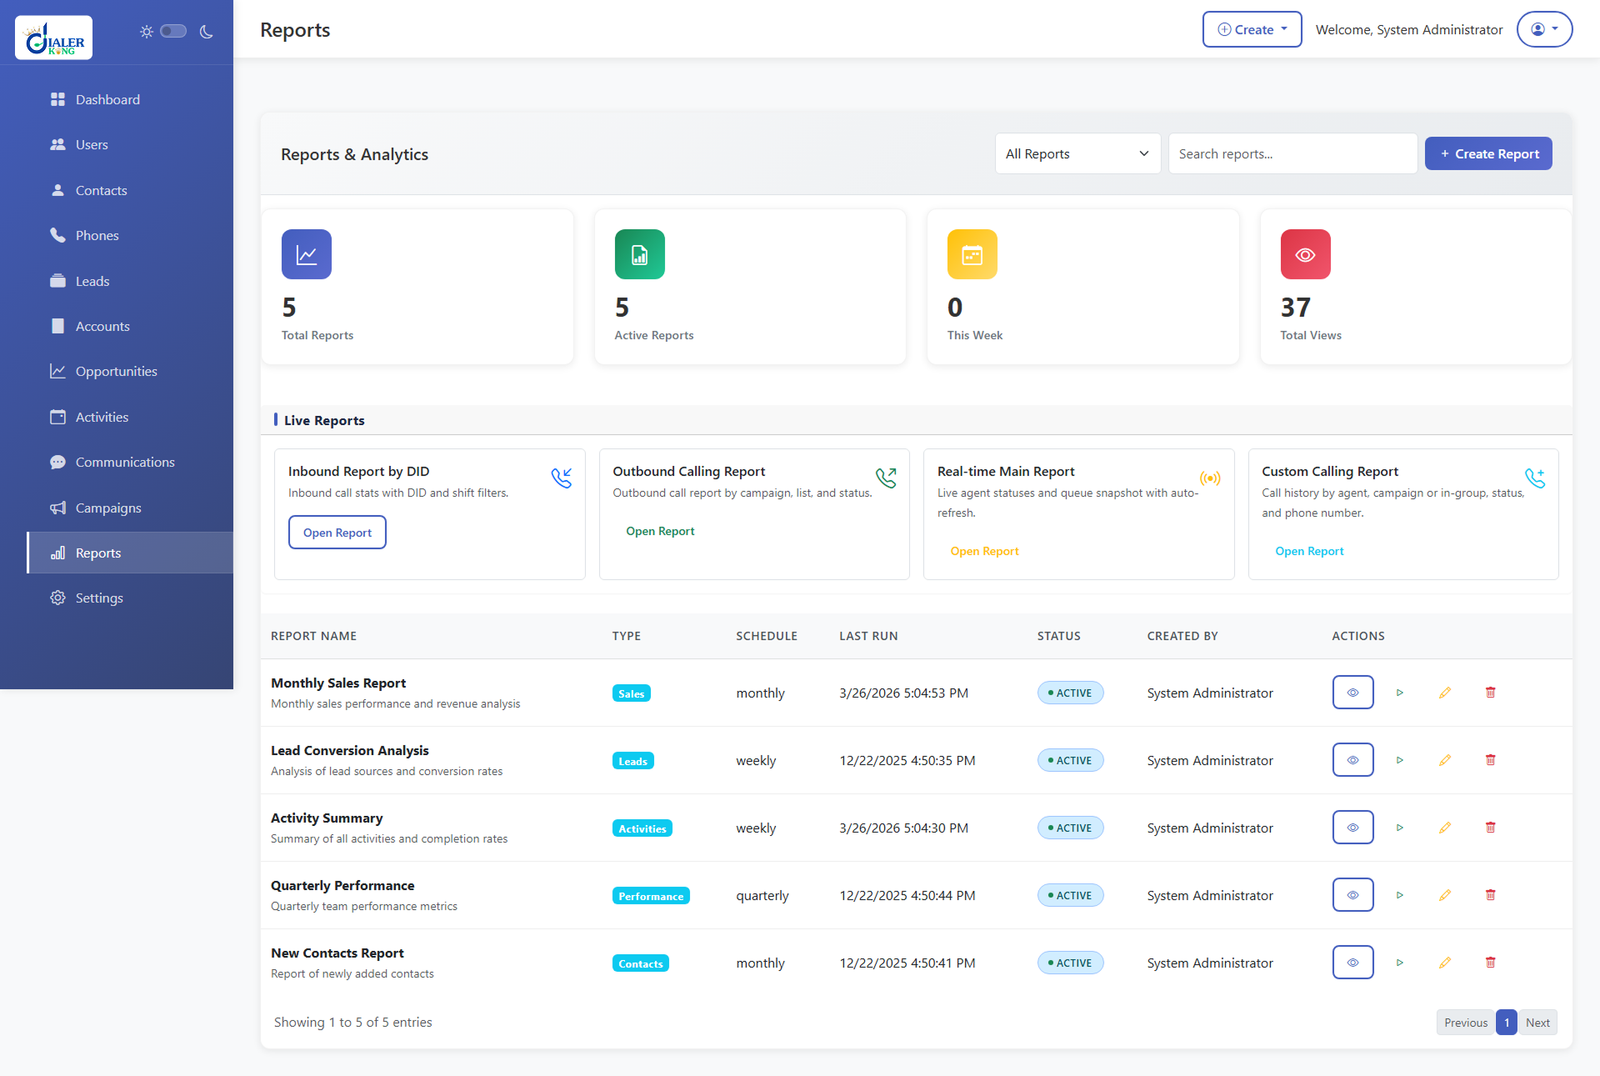
Scheduled Automated Reports
Beyond live monitoring, the dashboard generates scheduled PDF and CSV exports, daily, weekly, or monthly, delivered directly to defined recipients. Operations managers receive the previous day’s performance summary before their morning briefing. Senior leadership receives a weekly executive pack without submitting a single manual request.
Step-by-Step: How DialerKing Builds Your Custom Dashboard
The following process reflects DialerKing’s standard deployment methodology for contact centre dashboard projects. Timelines vary based on complexity, but the sequence is consistent across every engagement.
1. Discovery & Requirements Workshop
DialerKing engineers meet with operations management to document current reporting pain points, define the KPIs that matter most, map existing data sources (VICIdial tables, Asterisk CDR, CRM APIs), and establish role-based view requirements for agents, supervisors, team leaders, and senior management.
2. Data Architecture & Integration Mapping
Engineers audit the existing telephony and CRM database schema. Asterisk AMI event streams are mapped to dashboard data feeds. VICIdial’s MySQL tables are assessed for the live reporting fields required. Any gaps, such as custom disposition data or external CRM fields, are flagged for connector development.
3. Dashboard Wireframe & Widget Design
A prototype is produced in a staging environment. Each widget, queue monitor, agent panel, scorecards, campaign tracker, is positioned for the primary user role. Supervisors see queue health first. Agents see their personal KPI scorecard. Managers see campaign summaries.
4. Backend Development & Live Data Feeds
The real-time data pipeline is built: AMI event listeners, database query polling intervals, caching layers for high-frequency metrics, and WebSocket connections to the front-end dashboard. This layer governs refresh latency, typically sub-five-second for live queue data.
5. Threshold & Alert Configuration
Operational thresholds are configured against each KPI based on the client’s SLA targets and internal benchmarks. Alert logic, visual, email, or both, is implemented and tested under simulated breach conditions.
6. User Acceptance Testing (UAT)
Supervisors and managers use the dashboard in a parallel-run environment alongside existing reporting tools. Discrepancies are investigated. Widget positioning adjustments, additional KPIs, and threshold tweaks are applied based on operational feedback.
7. Go-Live & Training
The dashboard is deployed to production. DialerKing delivers role-specific training: a supervisor walkthrough covering queue monitoring and alert management, and a management session covering scheduled reports and trend analysis.
8. Post-Launch Support & Iteration
The first 30 days of live operation typically surface refinement requests: new widgets, adjusted layouts, additional automated reports, or KPI additions as the team identifies gaps. These are addressed within the post-launch support window.
Real-World Use Case: High-Volume Outbound Centre
A debt recovery contact centre operating with 140 agents across two shifts was running campaign performance reports from VICIdial’s native reporting interface. Supervisors exported CSV files manually, formatted them in spreadsheets, and distributed them by email, a process that consumed approximately 45 minutes per shift supervisor, per day.
DialerKing was engaged to build a custom built CRM dashboard integrating directly with their existing VICIdial installation. The project scope included:
A live campaign monitor showing connect rate, right-party contacts, and hourly dispositions for each of eight concurrent outbound campaigns. An agent panel displaying individual productivity scores updated every 30 seconds. Automated daily performance reports delivered to operations management and the compliance team at 07:00 each morning
Threshold alerts for dropped call percentage, a critical compliance metric in collections, triggering an immediate visual alert and email to the dialler administrator if the rate breached the regulatory ceiling
Within four weeks of deployment, the client reported complete elimination of manual reporting work for supervisors. More significantly, the compliance threshold alert triggered on two occasions in the first month, enabling the dialler team to reduce call pace before either incident escalated to a reportable breach.
This outcome, operational time savings alongside a concrete compliance risk reduction, represents the practical case for a purpose-built dashboard over generic reporting tools.
Integration with VICIdial, Asterisk & IVR Systems
DialerKing’s background in VICIdial configuration and Asterisk deployment means that dashboard integrations are built with direct knowledge of the underlying telephony architecture, not via generic API wrappers. This makes a meaningful difference to both data accuracy and refresh performance.
VICIdial Integration
VICIdial stores real-time agent state, queue data, and call records across several MySQL tables that update continuously during operations. DialerKing’s dashboard connects directly to these tables, reading live_agents, vicidial_live_inbound_agents, and vicidial_log , to populate agent panels and queue monitors with sub-five-second latency. Custom disposition mappings are fully supported, so client-specific outcome codes appear correctly in every reporting widget.
Asterisk AMI Integration
The Asterisk Manager Interface delivers event-driven updates for channel state changes, queue member status, and call progress events. DialerKing’s backend layer subscribes to the relevant AMI event categories and streams this data into the dashboard’s live data bus. This supports installations where VICIdial is not the primary dialler, including fully custom IVR deployments and blended contact centre configurations.
IVR Call Flow Reporting
For contact centres operating complex IVR trees, the dashboard surfaces IVR path analytics: how many callers reached each menu node, where callers abandoned the self-service flow, and what percentage transferred to a live agent versus completing the transaction without one. This data connects IVR performance to overall operational KPIs and is particularly valuable when optimising self-service containment rates.
Frequently Asked Questions
Conclusion
A custom CRM dashboard is not a luxury for large contact centres, it is the practical foundation for data-driven operations at any scale. When supervisors can see queue health, agent performance, and campaign metrics in real time, they make faster and more accurate decisions.
When managers receive automated performance reports without manual extraction, they reclaim hours every week, When compliance thresholds are monitored live with instant alerts, risk is managed proactively rather than retrospectively.
DialerKing brings hands-on VICIdial, Asterisk, and IVR deployment experience to every dashboard project. The result is an integration that is accurate, performant, and genuinely aligned with how your operation runs, because it was built with direct knowledge of the systems underneath it, not just the data they produce.
A modern CRM dashboard built with a scalable PHP backend helps businesses monitor leads, agent activity, customer interactions, and real-time performance metrics from a single centralized interface.
If your contact centre is relying on manual exports, delayed reports, or a generic dashboard that does not reflect your actual KPIs, the right next step is a structured scoping conversation. DialerKing’s engineering team will assess your current stack, identify the highest-value reporting gaps, and outline a dashboard build that addresses them directly.
Contact DialerKing today to discuss your custom dashboard requirements and get a scoped proposal for your contact centre.